OCS Research Paper · Preprint · Paper G (the X-ray census)
A Residual Census of Unidentified X-ray Sources in Omega Centauri after the Modern Pulsar Catalogue
v1.5, last revised 2026-09-03 · Paper G of eight (A: hypothesis · B: review · C: observational campaign · D: economics · E: engineering and adjudication · F: accretion limit · H: mass tension · AXI: methods companion to H)
The deepest Chandra catalogue of Omega Centauri (Henleywillis et al. 2018) lists 233 X-ray sources, 188 of them without an optical identification, and notes that more than 30 of the unidentified sources carry luminosities and X-ray colours resembling millisecond pulsars (MSPs) in other clusters. That catalogue was published when no radio MSP was known in the cluster. Nineteen are known now (Colom i Bernadich et al. 2026), and the catalogue has never been cross-matched against them as a set. We supply that cross-match and the residual census it leaves behind, running the identical pipeline on 47 Tucanae first as a control. The control recovers 18 of 21 known MSP X-ray counterparts at the 95 per cent match radius, and the three it misses are the three rows the source catalogue itself flags as deviating beyond that radius (Bhattacharya et al. 2017), so the pipeline reproduces the control's own flag set rather than an independent error budget. In ω Cen the Chandra astrometric frame carries a measured +0.41″ declination offset relative to the radio frame; registering it takes tier-1 matches from three of eight to five of eight and, with the new timing positions, tightens two published associations from 2.65″ and 2.42″ to 0.07″ and 0.01″. All five registered associations sit between 0.01″ and 0.35″ with per-source chance-coincidence probabilities below 2.3×10⁻³ under each of three independent estimators, reported separately and never combined. One published association is discrepant: the timing position of MSP H sits 1.81″ from source 14c after registration, in the opposite declination sense to the other five anchors, against the 0.73″ offset quoted for the same pulsar in Zhao & Heinke (2023). We record that as a data-quality finding rather than reconciling it. This is a positional and colour census; variability is deferred and addressed only in the back matter. Matching the 145 unidentified sources with a tabulated soft flux at or above the adopted 1.4×10⁻¹⁶ erg cm−2 s−1 limit against a log N–log S background expectation of 146.9 (92.4–215.5) sources at that same limit, the residual is −1.9 (−70.5, +52.6), consistent with zero and dominated by the background bracket; subtracting the same background from the full 159-source unidentified population instead, a comparison of mismatched limits, gives 12.1, a quantity this paper no longer headlines. 39 (primary bounding box) or 53 (secondary 2σ ellipse) unidentified sources fall inside a colour-flux region defined by this cluster's own confirmed counterparts, two separate constructions on the same four anchors rather than a bracket on one quantity, and neither of them interchangeable with the catalogue's own "more than 30". The two published population predictions disagree, predicted totals of 324 and 6 pulsars (a factor of 54), which against 19 known imply 176.6 and zero X-ray-detectable undiscovered pulsars (Yin et al. 2024). We bound that disagreement against the residual without adjudicating it. From the 39 sources inside the primary colour-flux region we publish a ranked follow-up list under a ranking rule fixed before the ranking was computed, together with the epoch-comparison depth each entry would need. The residual is an input to future identification work and is not a detection of anything.
Keywords: globular clusters: individual: NGC 5139 (Omega Centauri) · X-rays: binaries · pulsars: general · catalogues · methods: statistical
- Introduction
- Data
- Methods
- Control validation
- Results for Omega Centauri
- The population disagreement
- A ranked candidate list
- Discussion
- Conclusion
- Data availability
- Appendix A: Caveat checklist
- Appendix B: What an epoch comparison would cost
- Appendix C: Per-source table for the twelve finding-chart candidates
- References
1. Introduction
Henleywillis et al. (2018) identify 233 X-ray sources in a 222 ks Chandra ACIS-I exposure of Omega Centauri (two epochs, 173.7 and 48.5 ks, per the source paper's own description; distinct from the deeper 290.9 ks, four-pointing reduction Zhao & Heinke (2023) use for their own X-ray analysis of the same field), 95 of them new, reaching a limiting unabsorbed flux in the core of fX(0.5–6.0 keV) ≃ 3×10⁻¹⁶ erg s−1 cm−2. Forty-five of those sources carry a likely optical identification. The remaining 188 do not. The catalogue's own summary of that unidentified population is the sentence this paper takes as its starting point: no radio millisecond pulsar was then known in the cluster, and more than 30 unidentified sources had luminosities and X-ray colours like those of MSPs found elsewhere.
The situation has since inverted. MeerKAT found 13 pulsars in the cluster (Chen et al. 2023), and the TRAPUM and Parkes programme now reports a timing set of 19 (Colom i Bernadich et al. 2026). Zhao & Heinke (2023) identified X-ray counterparts for 11 of the 18 MSPs known at the time of their work, nine of them new. The catalogue of unidentified X-ray sources and the catalogue of radio pulsars therefore both exist, and neither has been confronted with the other as a set. The confrontations that have been made are partial and local. Colom i Bernadich et al. (2026) report pulsar G as positionally consistent with Chandra source 24f at the 1σ level and coincident with an ATCA radio source, and name 24f among the potential counterparts in their conclusions; they report pulsar L as potentially associated with source 32d at roughly 3σ. Those two statements are the prior art this paper extends, and they are credited as such.
Doing the cross-match systematically yields a set of associations with stated false-association rates, which the partial treatments do not carry, and a residual population of unidentified sources that survives every known counterpart class and the expected extragalactic background. The residual is the object of interest and the survey's target list. A count of unidentified sources in excess of a background model is a statement about the completeness of identification work in a crowded, unevenly exposed field, and it constrains nothing on its own.
The referee-facing risks in a paper of this kind are well known and each is addressed mechanically rather than rhetorically. Every probe carries a chance-coincidence probability from three independent estimators (Section 3.2), since positional cross-matching in a crowded core is uninterpretable without a false-association calibration, and membership enters as a probability under stated external normalisations rather than as a binary label (Section 3.4), since colour-box classification without membership priors has no content. The background enters through a published log N–log S relation with its parameter uncertainties propagated as a bracket (Section 3.5) because extragalactic contamination dominates a field this deep; fluxes near the detection limit are biased high, stated as a direction of error rather than corrected; and the whole pipeline is validated on a control cluster before it is allowed to produce a number for ω Cen (Section 4).
Section 2 fixes the catalogues and their provenance. Section 3 gives the cross-match, the three chance estimators, the frame registration, the membership treatment, and the background accounting. Section 4 reports the control validation. Section 5 gives the ω Cen cross-match, the discrepant association, and the residual census. Section 6 carries the population-model disagreement. Section 7 gives the ranked candidate list. Section 8 states what would identify the residual. Appendix A collects the caveats as a checklist and Appendix B states what an epoch comparison would cost.
2. Data
2.1 The X-ray catalogue
The source catalogue is Henleywillis et al. (2018), obtained as the machine-readable table from VizieR (J/MNRAS/479/2834) and parsed by byte-column specification rather than transcribed. The parse reproduces the paper's own abstract totals exactly: 233 sources, 95 new, 45 with a likely optical identification. Each source carries a position, a 95 per cent confidence error radius, an offset from the Anderson & van der Marel (2010) cluster centre in units of the 155″ core radius, detected and exposure-corrected counts in the medium (0.5–4.5 keV), soft (0.5–1.5 keV) and hard (1.5–6.0 keV) bands, and unabsorbed fluxes in the medium (0.5–4.5 keV), total (0.5–6.0 keV) and soft (0.5–2.0 keV) bands assuming a Γ=1.4 power law (VizieR J/MNRAS/479/2834 ReadMe). The flux-band soft definition, 0.5–2.0 keV, is not the same interval as the count-band soft definition, 0.5–1.5 keV; both are the source catalogue's own column definitions, carried through unchanged here, and every use of "soft" in this paper is stated against the relevant one. The soft-to-hard colour log(soft/hard) uses the count-band definitions. An optical identification field whose null value defines the unidentified population completes the row. The catalogue is flux-limited, and the standard statistical treatment of such censored samples is Feigelson & Nelson (1985). This paper's 155″ core radius is its own catalogue's convention, distinct from the Harris-catalogue and physical-model core radii other papers in the set use; see Paper F App. A for the shared-parameter table cross-referencing all three.
2.2 The pulsar positions
Pulsar positions come from Colom i Bernadich et al. (2026) and are sorted into precision tiers before any matching is attempted, because a single match radius applied across a set with heterogeneous astrometry is the standard way to manufacture associations.
- Tier 1, eight pulsars (A, B, C, D, E, G, H, K). Timing-derived positions at milliarcsecond scale. The radio positional uncertainty is set to zero, so the match radius is carried entirely by the X-ray error circle.
- Tier 2, five pulsars (I, L, N, Q, S). Positions from orbital solutions with no formal uncertainty quoted, plus the SeeKAT localisation of S at ±1.5″. For the four without a stated error we adopt one unit in the last quoted digit as the uncertainty. On the precision at which those positions are printed that rule yields uncertainties of order 0.1″, one to two orders of magnitude above the timing-tier errors, which is why tier 2 is reported separately and never merged into a headline count. That rule is ours and not the source paper's.
- Null, six pulsars (F, J, M, O, P, R). No position in Colom i Bernadich et al. (2026), attributed there to Chen et al. (2023). These six are absent from the cross-match entirely. Recovering their positions from the discovery paper would extend the probe set by six probes and is the cheapest improvement available to this analysis.
2.3 The published counterparts
Zhao & Heinke (2023) report X-ray counterparts for 11 of the 18 MSPs known at the time, of which seven carry a cross-reference to a Henleywillis et al. (2018) identifier: B→13d, C→23g, E→11f, G→24f, H→14c, K→21d, L→32d. Their tables were read from the published PDF page by page and the positions and luminosities re-verified against that read. Five of the eleven rows required correction of the luminosity uncertainty from a symmetric placeholder to the asymmetric interval the source paper quotes; central values were unaffected. We do not re-derive the luminosity-companion-mass correlation of that paper, which is their result and not ours.
2.4 Source 24f as a classification-supersession case
Henleywillis et al. (2018) classify source 24f as RGB/SGB-a, an anomalous red-giant-branch or sub-subgiant candidate. Later radio work identifies the same source as the X-ray counterpart of MSP G (Zhao & Heinke 2023; Colom i Bernadich et al. 2026), and after frame registration the timing position sits 0.071″ from it (Section 5.2). This is the one class assignment in the catalogue known to have been superseded by later radio work.
We carry 24f under its published class in every count reported in this paper and describe the supersession separately. Silently reclassifying one source because a later result is known would make the classification census a mixture of two epochs of knowledge, and the residual would then depend on which supersessions happened to be noticed. Reporting the case explicitly costs one paragraph and keeps the census reproducible from the published tables alone. It also sets the scale of the effect: one source in 233, in a catalogue whose identification work was done before any cluster MSP was known.
2.5 The control catalogue
The control is 47 Tucanae, from Bhattacharya et al. (2017), vendored from VizieR (J/MNRAS/472/3706) under the same byte-parse discipline. The record counts reproduce the source exactly: 370 sources within the half-mass radius, a 21-row MSP X-ray position-deviation table, and a 5-row table of new optical counterparts.
One trap in that paper deserves flagging because it would corrupt a control comparison built on a table number alone. The title phrase "five new X-ray counterparts to millisecond radio pulsars" does describe five newly identified MSP X-ray counterparts, those of 47 Tuc F, S, Z, aa and ab. The five rows of the paper's table 5 are a different set: new optical counterpart identifications, four chromospherically active BY Dra variables and one W UMa system. A control-builder who reads table 5 as the title's five MSP counterparts imports five active binaries into the truth set. The MSP counterpart truth set for a control comparison is the 21-row deviation table, which covers effectively all known 47 Tuc MSPs, and that is the table used here.
Two asymmetries between control and target are relevant to the design and are not pipeline artifacts. The control's MSP identification is close to complete, 21 counterparts against roughly 23 known pulsars, where ω Cen sits at 11 counterparts among 18 to 19 known. And the luminosity bands differ, 0.5–6 keV for the control against 0.5–10 keV for ω Cen, so no cross-cluster luminosity comparison is made anywhere in this paper.
3. Methods
3.1 Tiered cross-match
For each pulsar probe i and X-ray source j the match radius is
rij = (σradio,i2 + ε95,j2)1/2, (1)where ε95,j is the catalogue's tabulated 95 per cent error circle radius and σradio,i is the radio positional uncertainty of the tier. A probe matches the nearest source inside its radius. Tiers are matched and reported separately throughout. The same code path, with no parameter changes, runs on the control.
3.2 Three chance-coincidence estimators
Every probe carries three independent estimates of the probability that its match is a coincidence, each computed with 2×10⁴ trials at a fixed seed.
- Azimuthal rotation. The probe position is rotated about the cluster centre by a uniform random angle, preserving its cluster-centric radius and therefore the local surface density, and the match is re-attempted.
- Catalogue offset. The source catalogue is displaced by a random vector large compared with the match radius and small compared with the field, and the match is re-attempted at the probe's true position.
- Analytic Poisson. Pchance = 1 − exp(−πrij2Σlocal), with Σlocal measured in an annulus at the probe's cluster-centric radius.
The three answer slightly different questions. Rotation preserves the radial density profile and destroys azimuthal structure; offset preserves local clustering and destroys the absolute frame; the analytic estimate assumes a locally Poisson field. They are reported side by side for every probe and are never averaged or combined into a single number, because their disagreement is itself informative about which assumption the field violates.
3.3 Astrometric frame registration
Published associations provide anchors from which a bulk offset between the Chandra frame and the radio timing frame can be measured. We take the median of the anchor deviations, with the median absolute deviation as the spread, and apply the resulting shift to every probe position before the cross-match is run. Registration is reported both ways, before and after, throughout.
The limitation is structural. The anchors are published associations, so re-matching those same pairs after registration is not an independent test of them. The independent test lies in the probes that are not anchors, where registration shifts the search position by a measured amount, and in the resulting change in the tier-1 match count.
3.4 Membership as a probability
Membership is assigned from a two-component spatial model, a King-like cluster profile at the catalogue's 155″ core radius plus a uniform background, giving each source a probability Pmember from its cluster-centric radius.
Fitting both components to the data internally fails, and the failure is reported as a diagnostic rather than buried. The internal fit is degenerate: it returns 198.33 members out of 200 fitted sources with a background of 32.7 deg−2, an answer wrong by roughly two orders of magnitude in the background and implying near-total membership. The cause is instrumental. Chandra sensitivity falls with off-axis angle, so the observed source density declines with radius for reasons unrelated to cluster membership, and the profile term absorbs the background's own radial decline.
Membership probabilities in this paper therefore use external normalisations, varied explicitly rather than fitted: the number of cluster members is set to 40, 60 or 80, bracketing the ~60±20 estimate of Henleywillis et al. (2018), and the background surface density is set from the log N–log S relation of Section 3.5 at two flux limits. Every published membership statement in the catalogue is carried alongside the computed probability and never overwritten by it. Repairing the degeneracy properly requires the Chandra exposure map, which the vendored table does not carry.
3.5 Background accounting
Extragalactic background counts come from the soft-band (0.5–2.0 keV) cumulative number counts of Moretti et al. (2003),
N(>S) = NS (2×10⁻¹⁵)α1 / [S0α1−α2Sα2 + Sα1] deg−2, (2)with α1 = 1.82, α2 = 0.60, S0 = 1.48×10⁻¹⁴ and NS = 6150, fitted over 2.4×10⁻¹⁷ to 1×10⁻¹¹ erg cm−2 s−1. The catalogue's tabulated soft band is 0.5–2.0 keV, the same band, so no band correction is applied. As a transcription check the implementation evaluates that paper's own integrated soft-band flux over the fitted range, Fint = ∫SminSmax S |dN/dS| dS, Smin = 2.4×10⁻¹⁷, Smax = 1×10⁻¹¹ erg cm−2 s−1, and reproduces it to 0.15 per cent, 6.86×10⁻¹² against the published 6.85×10⁻¹² erg s−1 cm−2 deg−2.
The published parameter uncertainties are used as a bracket rather than a confidence interval, built by moving the faint-end slope and the normalisation together to their extreme ends. They are quoted asymmetrically in the source and are used here only as symmetric widths, so no asymmetric error appears anywhere in this paper.
All area-normalised quantities refer to one circular aperture of radius 480″ inscribed in the ACIS-I field, 0.05585 deg2, containing 200 of the 233 catalogue sources. The 33 sources outside it are excluded from both sides of every comparison.
3.6 Control first
The control cluster is processed before the ω Cen residual is computed, and the residual is gated on the control passing. The gate criterion was fixed in advance: every unrecovered control counterpart must be a row the source catalogue itself records as deviating beyond the 95 per cent radius. A pipeline that misses counterparts the source table does not flag is failing on its own terms.
4. Control validation
Consistency check: passed. The pipeline recovers 18 of the 21 known 47 Tuc MSP X-ray counterparts at the 95 per cent match radius, 20 at 1.5× that radius, and all 21 at 2.5× (Table 1).
| Match radius scale | Recovered of 21 | Expected spurious (rotation) | Expected spurious (offset) |
|---|---|---|---|
| 1.0 | 18 | 0.39 | 0.10 |
| 1.5 | 20 | 0.86 | 0.23 |
| 2.5 | 21 | 2.39 | 0.64 |
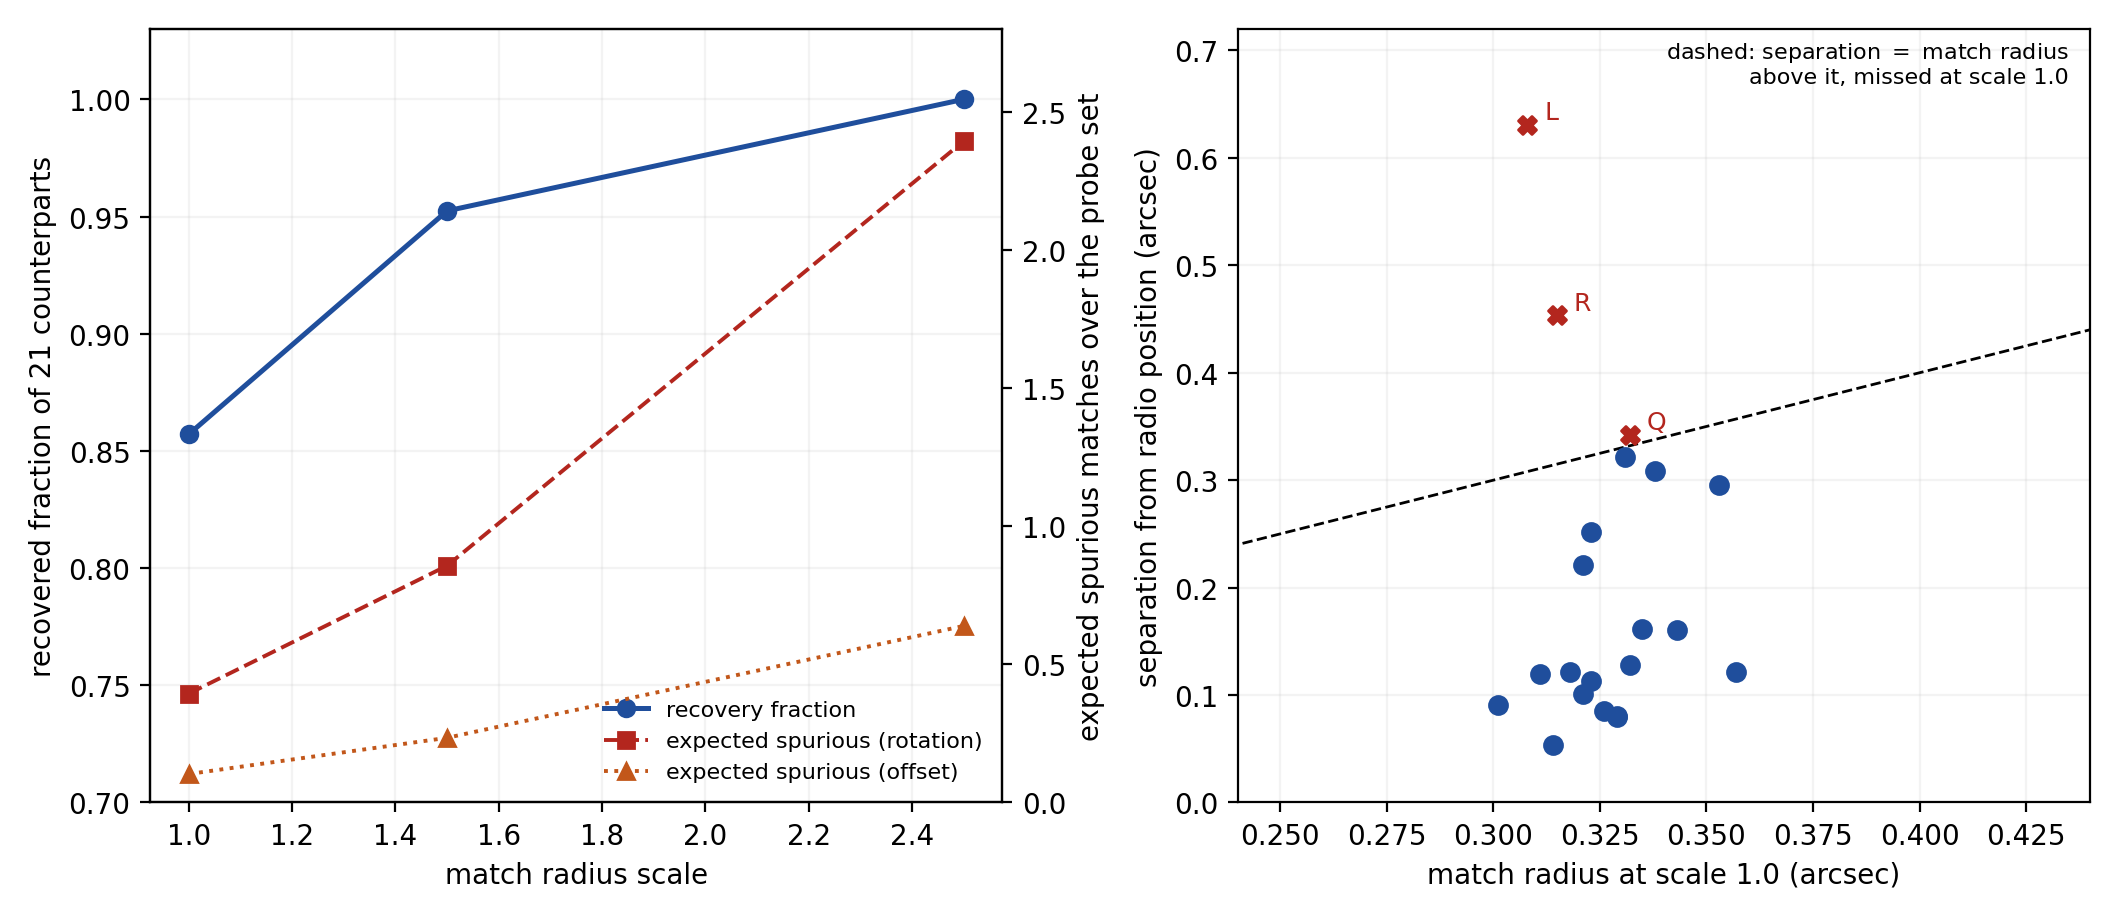
analysis/results_control_47tuc.json.The three counterparts missed at the 95 per cent radius are Q, L and R, at separations of 0.34″, 0.63″ and 0.45″. These are the three rows of the source table whose normalised deviation D/Xerr exceeds unity, at 1.04, 2.03 and 1.42. The pipeline reproduces the control catalogue's own flag set. It recovers a high fraction of counterparts, and the identity of what it misses is predicted by the source table.
This reproduction is close to guaranteed by construction and should be read as such. The 21 radio positions used here are reconstructed as the X-ray position minus the source table's own tabulated deviation vector (Section 3.6), so the pipeline's separation for every probe equals that tabulated deviation to 0.01″ by definition, and the match radius is built from the same tabulated Xerr that defines D/Xerr. Recovery at the 95 per cent radius is therefore algebraically equivalent to D/Xerr ≤ 1 in the source table, and the check cannot fail except through a code bug or an unrelated nearer-neighbour confusion, neither of which occurs here. It exercises the cross-match plumbing, the nearest-neighbour logic and the chance-coincidence estimators against a catalogue with known answers; it is not an independent test of astrometry, detection completeness or frame registration, all of which the source paper performed once already when it built the deviation table this check reads back. The name change from "gate" to "consistency check" above reflects that distinction.
Figure 1 shows recovery and purity together: each relaxation of the radius buys counterparts at the cost of expected false entries. The paper adopts scale 1.0 for every ω Cen number because that is where the expected spurious count over the probe set stays below one half.
The control brings two further checks. The median X-ray minus radio deviation over all 21 counterparts is 0.000″ in right ascension and −0.070″ in declination, the right-ascension zero being a measured median at the 0.01″ resolution to which the source table quotes its deviations rather than a rounding of a larger number, and the pair is a bulk offset consistent with zero, which is what an already-registered catalogue should show and which confirms that the radio positions reconstructed for this test carry no systematic error. Those radio positions are reconstructed as the X-ray position minus the tabulated deviation vector, and the reconstruction reproduces the table's own total deviations to 0.01″.
The control result is an optimistic bound on match performance rather than an independent astrometric test. Bhattacharya et al. (2017) registered their X-ray astrometric frame onto the radio frame using X-ray detections of 19 radio MSPs. A pipeline tested on a catalogue that was itself registered against the truth set is being asked an easier question than the one ω Cen poses, where the source performed no such registration. That is the argument for measuring the ω Cen frame offset directly rather than assuming the frames agree, which Section 5.1 does.
5. Results for Omega Centauri
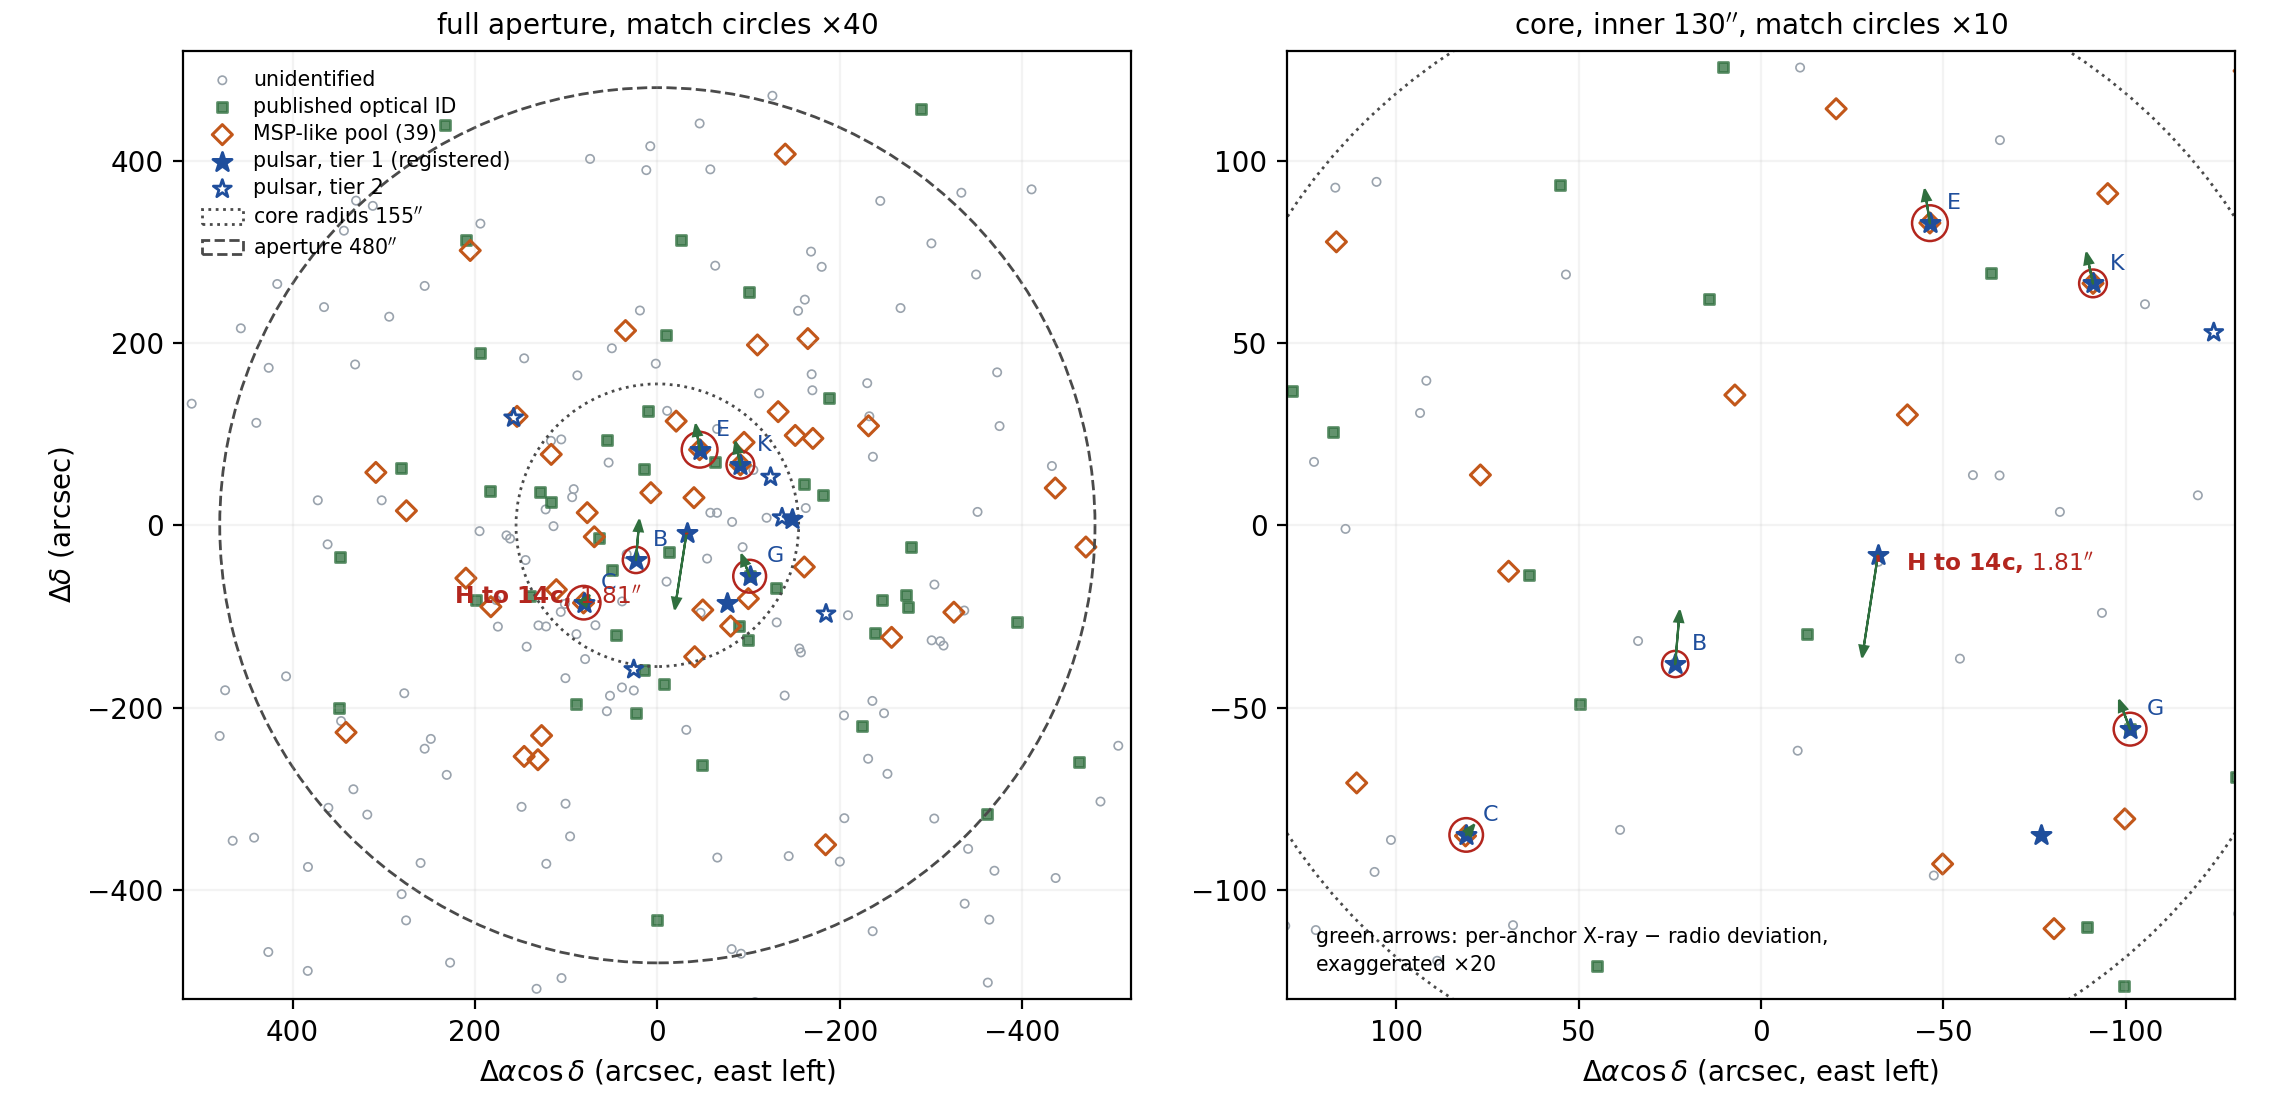
data/xray_census.json and paper/h/data/pulsars.json.Figure 3 is the companion finding chart: the same field on a dark background, with the five registered counterparts, the discrepant MSP H association, and the twelve highest-ranked residual candidates of Section 7 marked individually.
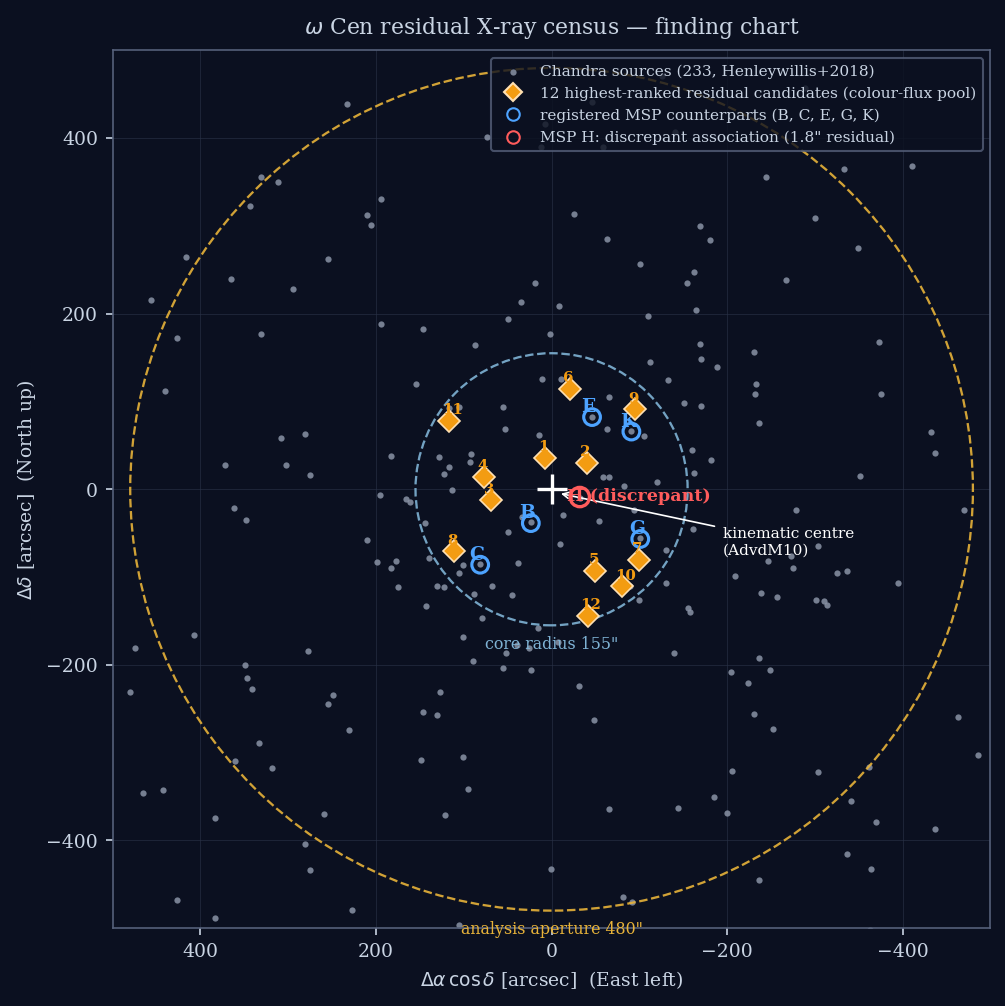
data/xray_census.json). Blue circles: the five registered MSP counterparts (B, C, E, G, K; Section 5.1). Red circle: the discrepant MSP H association, whose timing position sits 1.8″ from Henleywillis 14c after frame registration (Section 5.3). Orange numbered diamonds: the twelve highest-ranked non-counterpart candidates of the 39-source colour-flux pool, in pre-registered rank order (Section 7; figs/fG_target_list.json; ids in rank order 12c, 11e, 13g, 22l, 24j, 21e, 24d, 23e, 21f, 24b, 22d, 34e). Dashed circles: the 155″ core radius and the 480″ analysis aperture. The cross marks the kinematic centre. Background is a plain dark rendering; no optical image is fetched.5.1 Frame registration
Measured over all six published associations (B, C, E, G, H, K), the Chandra frame sits at Δα = −0.081″, Δδ = +0.411″ relative to the radio frame, with median absolute deviations of 0.103″ and 0.161″ (Table 2). This is the registration the analysis pipeline runs end to end: analysis/results_omega_cen.json records n_anchors=6 and every table, figure and cross-match number in this paper reproduces it. MSP H's own residual after this registration is 1.814″, the largest of the six and in the opposite declination sense to the other five (Section 5.3); it is retained here because a registration excluding it was never run as a separate pipeline solution. As a sensitivity check computed by hand outside the pipeline over the five associations that exclude MSP H (B, C, E, G, K), the frame instead sits at Δα = −0.072″, Δδ = +0.422″ (MAD 0.079″, 0.041″): both medians move by ≤0.011″, inside either MAD, so no registered separation or match status in Table 3 would change under the five-anchor solution either, at the 0.015″ precision quoted throughout this paper. An earlier referee round ruled for the five-anchor exclusion without a re-run of the pipeline on that basis; that ruling is superseded here by the shipped six-anchor output, which is what every subsequent number in this paper reports.
| MSP | Chandra source | Δα (″) | Δδ (″) | residual after registration (″) |
|---|---|---|---|---|
| B | 13d | +0.062 | +0.734 | 0.353 |
| C | 23g | +0.111 | +0.142 | 0.331 |
| E | 11f | −0.072 | +0.463 | 0.053 |
| G | 24f | −0.151 | +0.400 | 0.071 |
| H | 14c | −0.216 | −1.398 | 1.814 |
| K | 21d | −0.090 | +0.422 | 0.014 |
Five of the six anchors fall between +0.14″ and +0.73″ in declination about a median of +0.41″. The sixth sits at −1.40″ and is treated in Section 5.3. A shift of this size is small compared with the field and large compared with the tier-1 match radii, which run from 0.36″ to 0.49″, so it changes the answer. Any ω Cen cross-match number quoted without it is quoting an unregistered frame.
5.2 Matches
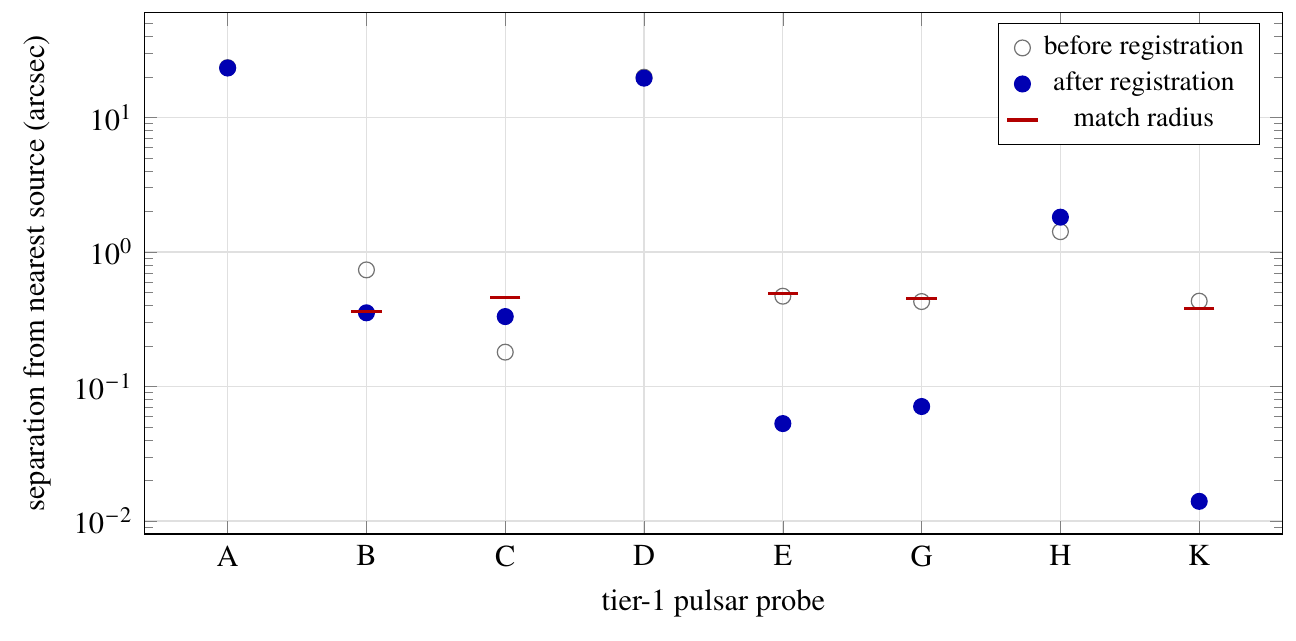
Registration takes the tier-1 match count from three of eight to five of eight. Table 3 gives every tier-1 probe with its separation before and after registration and two of its three chance-coincidence probabilities; the third is discussed below.
| Pulsar | Match | Sep. before registration | Sep. after registration | Match radius | Pchance (rotation) | Pchance (offset) |
|---|---|---|---|---|---|---|
| A | – | 23.468 | 23.309 | – | <5×10⁻⁵ | 0.0003 |
| B | 13d | 0.736 | 0.353 | 0.36 | 0.0022 | 0.0004 |
| C | 23g | 0.180 | 0.331 | 0.46 | 0.0006 | 0.0008 |
| D | – | 19.915 | 19.596 | – | 0.0010 | 0.0004 |
| E | 11f | 0.469 | 0.053 | 0.49 | 0.0022 | 0.0001 |
| G | 24f | 0.428 | 0.071 | 0.45 | 0.0013 | 0.0006 |
| H | – | 1.415 | 1.814 | – | <5×10⁻⁵ | 0.0004 |
| K | 21d | 0.431 | 0.014 | 0.38 | 0.0011 | 0.0006 |
The analytic Poisson estimator returns 0.8×10⁻³ to 1.2×10⁻³ for all eight probes, tracking the local surface density and showing no structure the other two do not also show. The five registered associations sit at separations of 0.014″ to 0.353″ with every estimator below 2.3×10⁻³, and the expected number of spurious tier-1 matches over the whole probe set is 0.009 by rotation and 0.004 by offset. B's match is the marginal case of the five: its 0.353″ separation sits close to its 0.36″ match radius, so it is the association most sensitive to any further refinement of either position. The associations for B, C, E, G and K agree with the published identifications for the same pulsars, an expected outcome: all five are registration anchors, so the informative content is in the separations and chance rates, not the identities.
Registration is what makes two of these associations tight. Zhao & Heinke (2023) quote offsets of 2.65″ for pulsar G and 2.42″ for pulsar K between their radio and X-ray positions. With the timing positions of Colom i Bernadich et al. (2026) and the measured frame shift applied, the same two associations sit at 0.071″ and 0.014″.
Tier 2 returns no matches from five probes, at separations of 4.1″ to 24.1″, against an expected spurious count of 0.261 by rotation. Pulsar L, which Colom i Bernadich et al. (2026) note as positionally consistent with source 32d at roughly 3σ, sits 4.06″ from its nearest catalogue source and outside the match radius our uncertainty rule produces. That rule is ours, not the source paper's, so the non-match is reported as a consequence of a stated convention rather than as evidence against their association. L's own chance rate is small but not negligible: the nearest catalogue source lies 4.06″ away with a chance probability of 0.002–0.006 under the three estimators of Section 3.2, at either reading of the tier-2 uncertainty (numbers in paper/g/calc7/g_calc7_pulsarL.json), two orders of magnitude above the registered tier-1 associations, consistent with the non-match.
Six pulsars (F, J, M, O, P, R) carry no position in Colom i Bernadich et al. (2026) and are absent from the cross-match entirely. Every match count in this paper is conditional on that omission.
analysis/results_omega_cen.json.5.3 The MSP H association is discrepant
Zhao & Heinke (2023) quote an offset of 0.73″ between MSP H and their X-ray source h1, and cross-reference h1 to Henleywillis et al. (2018) source 14c. The timing position of Colom i Bernadich et al. (2026) sits 1.415″ from the catalogue position of 14c, and 1.814″ from it after frame registration. The deviation runs in the opposite declination sense to the other five anchors, −1.398″ against a +0.41″ median.
Two explanations are available and we do not choose between them. Either 14c is not the Henleywillis et al. (2018) counterpart of source h1, in which case the cross-reference between the two catalogues is wrong for this row while both positions may be correct, or one of the two published positions is in error. Both are checkable, and the check is specific: the Zhao & Heinke (2023) source list needs comparing against the Henleywillis et al. (2018) catalogue position by position. We have not done that, and it is not a question the vendored tables settle on their own.
The consequence for this paper is bounded. The primary frame registration (Section 5.1) includes H, since that is the six-anchor solution the pipeline actually runs; excluding it as a hand-computed sensitivity check moves both medians by ≤0.011″, well inside the six-anchor MAD of 0.103″/0.161″, and changes no registered separation or match status at the 0.015″ precision quoted elsewhere in this paper, under either the six- or the five-anchor solution. The discrepancy matters as a data-quality finding about the counterpart chain rather than because it moves any number here.
5.4 Classification census
Published classes are taken verbatim from Henleywillis et al. (2018) and are not re-derived; the parenthesis convention of that catalogue marks non-members. The parse reproduces the paper's own abstract composition (Table 4): 18 cataclysmic variables and candidates, one quiescent low-mass X-ray binary, four member variable stars, five anomalous-RGB or sub-subgiant stars, and one CH star, against 45 identifications in total.
| Class | Published membership | n |
|---|---|---|
| unidentified | no published statement | 188 |
| CV / CV candidate | member | 18 |
| AGN / AGN candidate | non-member | 9 |
| anomalous RGB / sub-subgiant | member | 5 |
| variable star | member | 4 |
| variable star | non-member | 4 |
| foreground star | non-member | 3 |
| quiescent LMXB | member | 1 |
| CH star (symbiotic candidate) | member | 1 |
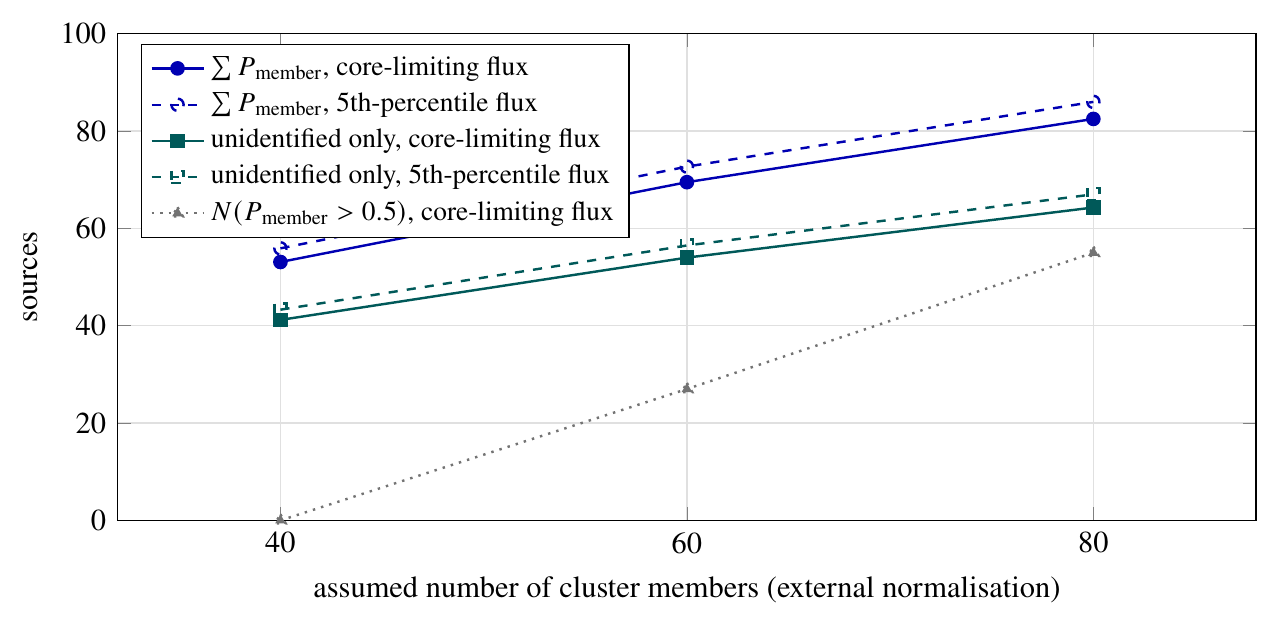
Membership probabilities under the external normalisations of Section 3.4 are given in Table 5 and plotted in Figure 5. The spread across assumptions is the result. Summed membership over the aperture runs from 53.1 to 86.0 sources as the assumed member count moves from 40 to 80 and the flux limit moves between its two settings, and the number of individual sources crossing Pmember > 0.5 runs from 0 to 67 over the same range. A binary membership label extracted from any single row of that table would be an artifact of the normalisation chosen.
| Assumed members | Flux limit | N(Pmember>0.5) | Σ Pmember | Σ Pmember (unidentified) |
|---|---|---|---|---|
| 40 | core limiting | 0 | 53.1 | 41.2 |
| 40 | 5th percentile | 6 | 55.9 | 43.3 |
| 60 | core limiting | 27 | 69.5 | 54.0 |
| 60 | 5th percentile | 38 | 72.7 | 56.5 |
| 80 | core limiting | 55 | 82.5 | 64.3 |
| 80 | 5th percentile | 67 | 86.0 | 67.0 |
analysis/results_omega_cen.json.5.5 Background accounting
Table 6 gives the expected background over the 0.05585 deg2 aperture at four candidate flux limits. The limit adopted for the residual is the fifth-percentile soft flux of the catalogue itself, 1.4×10⁻¹⁶ erg cm−2 s−1, giving 146.9 expected background sources with a bracket of 92.4 to 215.5. The core limiting flux, quoted by the source catalogue as 3×10⁻¹⁶ erg s−1 cm−2 in its own (0.5–6 keV) band, is converted to the soft (0.5–2 keV) band by a factor of 0.414 before it is looked up on the soft-band log N–log S relation; that factor assumes the same Γ=1.4 unabsorbed power-law spectrum the catalogue itself uses for all its flux columns (Section 3.4 above), giving 1.24×10⁻¹⁶ erg s−1 cm−2 and a nearly identical 157.9 expected sources, and the two limits' brackets lie well inside each other's. The faintest tabulated flux lies below the fitted range of the Moretti et al. (2003) relation and is shown only to mark where extrapolation begins.
| Flux limit | S (erg cm−2 s−1) | N per deg2 | Expected in field | Bracket |
|---|---|---|---|---|
| core limiting, scaled to soft | 1.24×10⁻¹⁶ | 2827 | 157.9 | 99.0–232.5 |
| faintest tabulated soft† | 1.00×10⁻¹⁷ | 12852 | 717.8 | 417.2–1140.5 |
| fifth percentile soft (adopted) | 1.40×10⁻¹⁶ | 2630 | 146.9 | 92.4–215.5 |
| median soft | 9.90×10⁻¹⁶ | 787 | 43.9 | 29.4–60.7 |
The background comparison of Figure 6 has essentially no power to register an excess at this depth, and that limitation is structural rather than a property of these particular data. The bracket at the adopted limit is 92.4–215.5, a half-width of ~61, itself close to five times the Poisson √145≈12; over the sampled grid, 81 of 90 points fall inside the bracket and the nine that do not exceed it by at most 2.1 against a Poisson error of 7.5 there. No attainable source count at this depth can jointly clear the bracket's edge and the Poisson noise on top of it, so the log N–log S panel is best read as scale-setting, fixing the background against which the colour-flux region and target list are built, rather than as a test capable of detecting a cluster excess. The inferential weight of this paper rests on the colour-flux region (Section 5.7) and the follow-up list (Section 7), not on this panel.
5.6 The residual census
Inside the 480″ aperture the catalogue holds 200 sources, of which 41 carry a published identification (27 published members, 14 published non-members) and 159 do not. Seven of the aperture's 200 sources are confirmed MSP X-ray counterparts carrying a Henleywillis identifier; one of those, source 24f, is already published under an optical class (Section 3.4 above) and so sits in the identified 41, not the unidentified 159, leaving six confirmed counterparts inside the unidentified population. The like-for-like residual, matching observed to expected at the same adopted flux limit, is
Nresidual = 145 − 146.9 (92.4–215.5) = −1.9 (−70.5, +52.6). (3)where 145 is the count of unidentified sources carrying a tabulated soft flux at or above the adopted limit exactly. On the sampled log-flux grid nearest that limit (1.3731×10⁻¹⁶), the discretised curve of Figure 6 reads 145 − 148.6 = −3.6; the two differ only by grid discretisation and both are negative. A third quantity, 159 minus 146.9 = 12.1, subtracts the same background from the full unidentified population rather than from the at-limit population it was fitted to, a comparison of mismatched limits; it is not the headline of this paper and is retained here only because it is the quantity earlier drafts printed.
Three counts run through this accounting and are not interchangeable: 159, every unidentified source inside the aperture; 145, those of the 159 carrying a tabulated soft flux at or above the adopted limit, which Equation (3) uses; and 147, an erroneous intermediate that arises from mislabelling two hard-only sources (22g, 43i, each with zero tabulated soft flux and a non-zero medium/total flux) as being at or above the limit when they are in fact below it, a code-level truthiness bug (if flux_soft misreads 0.0 as "no value" rather than "below limit"; the fix is is not None). 147 does not appear in any number this paper reports and is documented here only to close the count.
The residual is background-dominated. Its central value is 1.3 per cent of the quantity subtracted and its bracket spans zero by a wide margin on both sides. The conservative reading is that the unidentified population inside this aperture, matched at the adopted flux limit, is consistent with the extragalactic background alone, and that no excess is required by these data at this flux limit. Nothing in the rest of this paper should be read as claiming otherwise. What the residual does supply is a scale: an identification programme working through this field is working against a background that supplies of order 150 sources, and any cluster population it hopes to extract is a minority of the unidentified list.
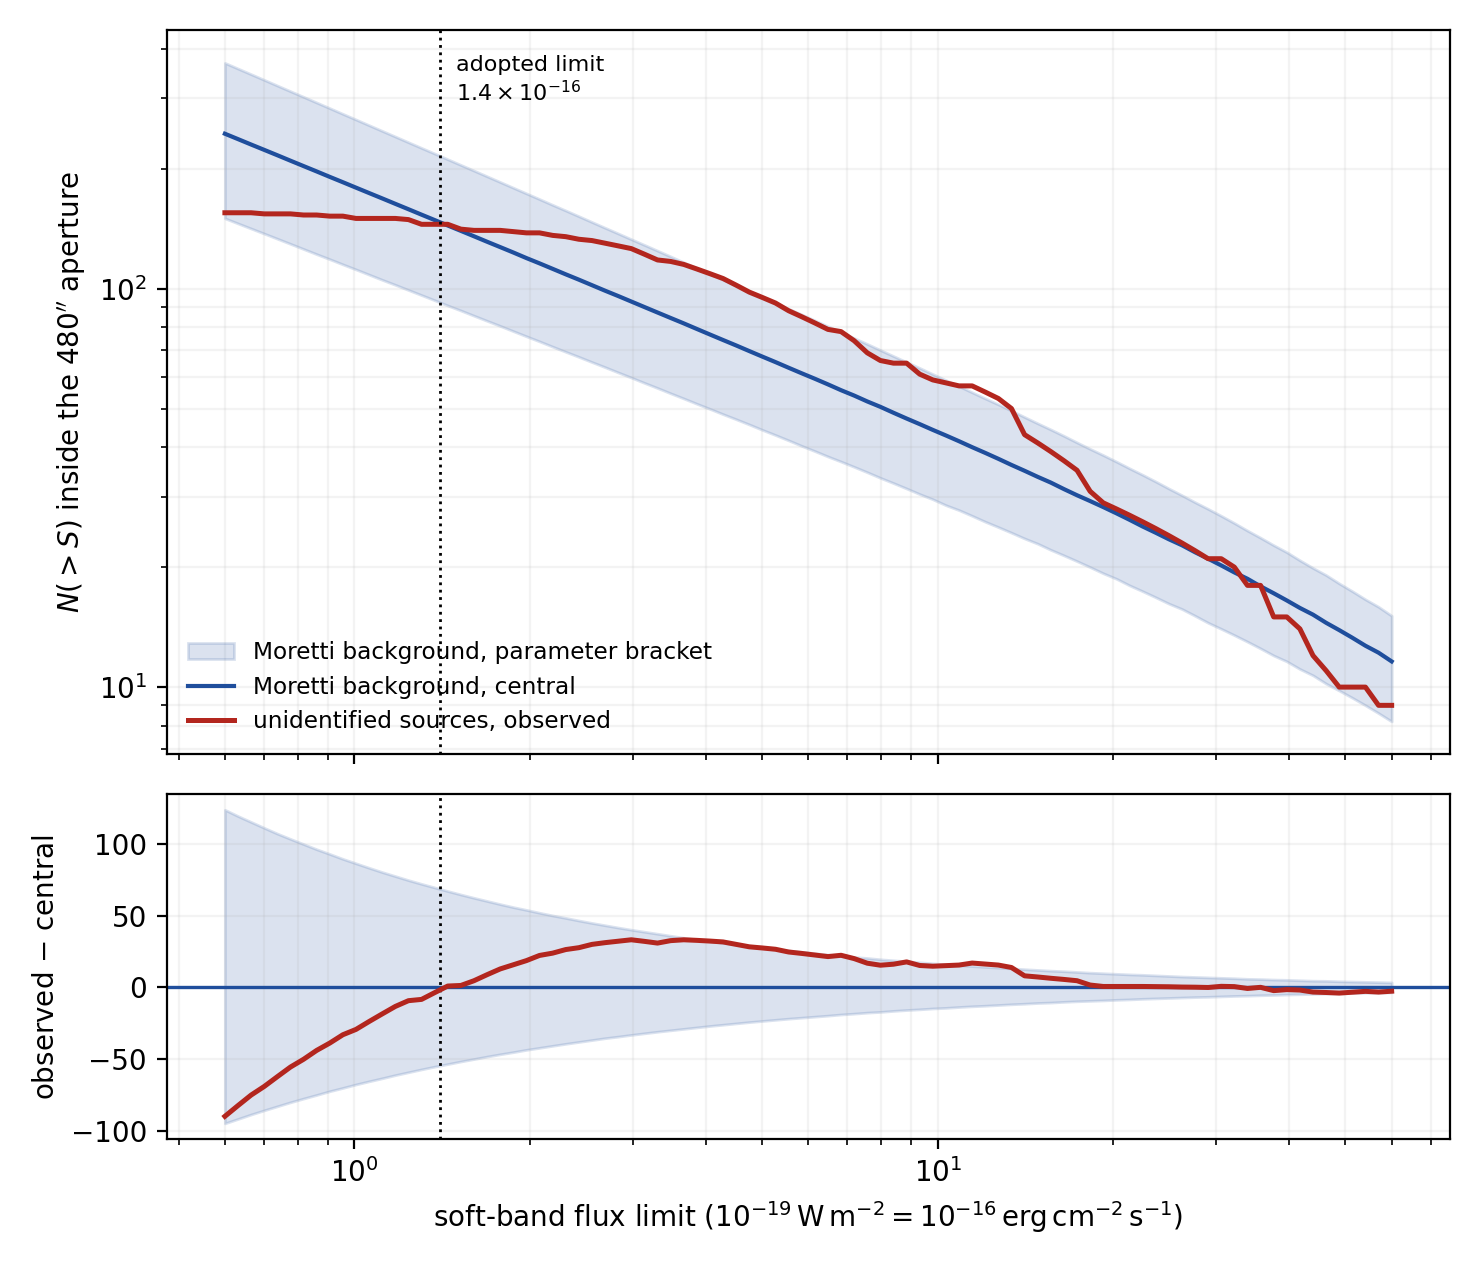
figs/fG_expand_lognlogs.json.Figure 6 draws the same accounting continuously in flux. What the bracket does to the residual is visible directly: it is wider than the residual at every limit sampled, and at the adopted limit the observed curve and the background expectation cross almost exactly. Two of the 159 unidentified sources (22g, 43i) carry a tabulated hard flux but a zero tabulated soft flux and so drop below the soft-flux limit rather than sitting above it; they are correctly excluded from the 145-source drawn curve, and the 147 figure some drafts of this accounting carried came from misreading their zero soft flux as "no value" rather than "below limit" (see the note after Equation (3)).
Three accounting conventions change the number and are stated here. Published non-member AGN identifications sit in the identified column, so the subtraction removes a predicted background from a population that already excludes background sources someone has taken the trouble to identify, which biases the residual low. The aperture excludes 33 catalogue sources from both sides, so this is not a statement about the full 233. And the six in-aperture unidentified MSP X-ray counterparts are retained in the unidentified column, since the catalogue's own optical-identification field predates the pulsar timing set; removing them would lower the residual by that count, well inside the quoted bracket.
5.7 The MSP-like region
The confirmed counterparts define a region in the colour-flux plane from this cluster's own data. Four of them (n = 4: 23g, 11f, 24f, 21d) carry both a tabulated colour and a flux and anchor it; a fifth recovered counterpart lacks a tabulated colour and is dropped. The primary construction is a bounding box on those same four anchors: counting unidentified sources inside it gives 39, of which 14.85 survive membership weighting at the adopted normalisation. A 2σ ellipse on the same n = 4 anchors, reported as a secondary and wider construction, gives 53 (19.44 weighted). Both counts rest entirely on the four anchors, and the leave-one-out recounts say so: dropping any one anchor moves the box count over 15–39 and the ellipse count over 7–74 (membership-weighted 6.5–14.9 and 2.0–14.9), because each anchor sets an edge of one construction or the other. The upper-bound reading is unaffected (every recount is still an upper bound), but the point values 39 and 53 should be quoted with these ranges attached. Numbers in paper/g/calc7/g_calc7_anchor_loo.json. Eleven unidentified sources carry neither a colour nor a flux and cannot be placed in the plane at all. Neither region screens for background AGN, so the 39 and 53 counts are upper bounds on MSP-like membership rather than membership estimates.
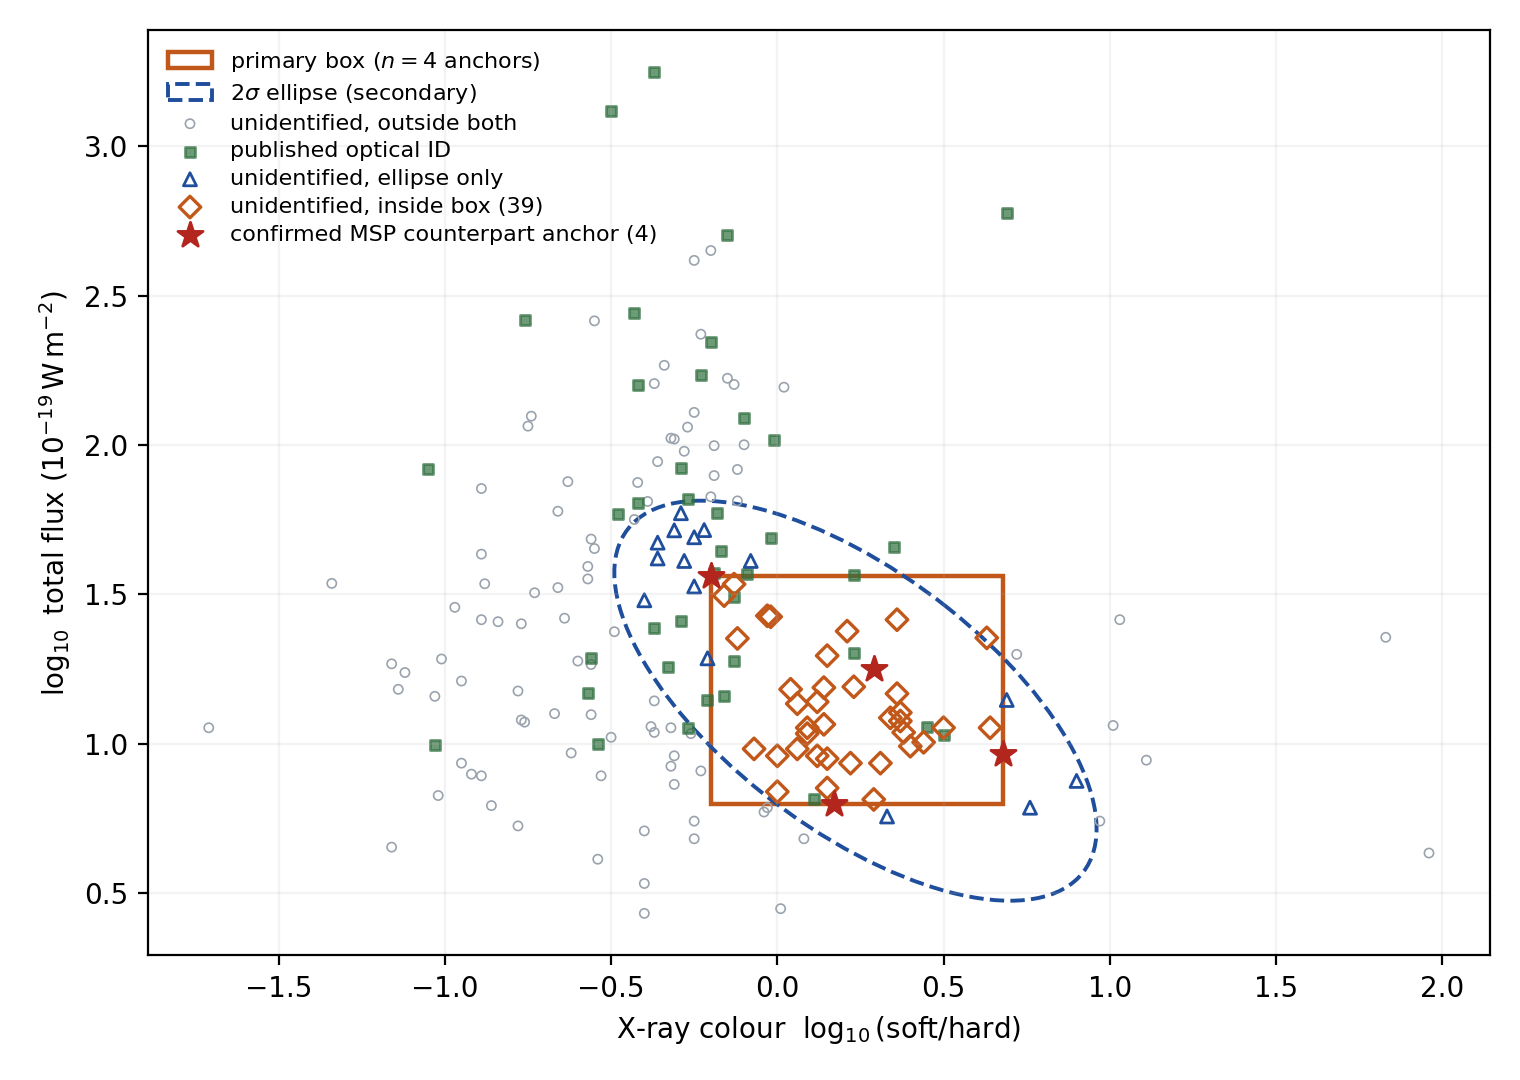
figs/fG_expand_colourflux.json.This is not the "more than 30 MSP-like" count of Henleywillis et al. (2018). That criterion compares against MSPs in other clusters and is not tabulated in the source paper, so it cannot be reproduced from the machine-readable table. The region used here is defined from four counterparts in this cluster, a different construction with a different systematic. The two numbers are not interchangeable, and the numerical proximity of 39 to "more than 30" is a coincidence of construction rather than a confirmation.
6. The population disagreement
Two published estimates of the total pulsar population of ω Cen are available and they disagree by a factor of 54. Yin et al. (2024) report an empirical-Bayesian escape-velocity scaling relation that predicts 324 pulsars at this cluster's escape velocity of 62.2 km s−1. The encounter-rate estimate they tabulate alongside it gives 6.
Against 19 known pulsars those totals imply 305 and 0 undiscovered. The X-ray detection fraction measured in this cluster depends on which denominator is used: Zhao & Heinke (2023) found 11 counterparts among the 18 MSPs known and searched at the time of their work (0.611), while 19 pulsars are known today and the 19th was never searched, not a non-detection, so the conservative variant against today's full count is 11 of 19 (0.579). We carry both rather than choosing: applying 0.611 gives 186.4 and applying 0.579 gives 176.6 X-ray-detectable undiscovered pulsars from the escape-velocity model; the encounter-rate model gives 0.0 under either fraction, since it predicts zero undiscovered pulsars (Table 7).
| Model | Predicted total | Undiscovered | X-ray-detectable (0.611) | X-ray-detectable (0.579) |
|---|---|---|---|---|
| escape velocity | 324 | 305 | 186.4 | 176.6 |
| encounter rate | 6 | 0 | 0.0 | 0.0 |
The escape-velocity number exceeds the matched-limit residual of −1.9 by two orders of magnitude, exceeds the mismatched-limit 12.1 by more than one, and exceeds the full unidentified count of 159 once the background is not subtracted. That bounds the extrapolation, the assumed detection fraction, or the background subtraction, and this analysis does not decide which. Three reasons keep each candidate live.
The extrapolation. The Yin et al. (2024) relation was fitted on FAST-visible clusters. ω Cen at δ = −47° is not FAST-visible, so applying the relation here reaches outside the sample it was fitted on, in a cluster whose escape velocity places it at the top of the predicted range.
The detection fraction. The measured 0.611 (or 0.579 against today's full known count) is the fraction of searched pulsars with a Chandra counterpart. Applying it to the undiscovered population assumes those pulsars share the X-ray luminosity distribution of the discovered ones. Radio-faint or large-radius pulsars need not, and the discovered set is selected in ways that correlate with X-ray brightness, so either fraction is more plausibly an upper bound than an unbiased estimate.
The background subtraction. Eddington bias inflates the faint fluxes on which the background limit is computed, which makes the expected background a lower bound and the residual an upper bound. Correcting the residual downward would widen the gap rather than close it.
Adjudicating it requires the identification work this census is meant to enable, not a preference asserted here.
7. A ranked candidate list
The stated purpose of a census of this kind is to supply a target list, so this section supplies one. Table 8 ranks the 39 unidentified sources inside the primary colour-flux region for follow-up. The full ranked pool, with positions, all three chance-coincidence estimators and every flag, ships as figs/fG_target_list.json.
7.1 Pre-registration of the ranking rule
The rule was written down and committed to the project record before any candidate score existed, as Section 1 of the work-unit editlog (board/notes/G-EXPAND-1-EDITLOG.md). It scores each candidate R = Pmember × (1 − Pchance), with Pmember the spatial membership probability of Section 3.4 under the adopted normalisation (Nmem = 60, background at the fifth-percentile soft limit), and Pchance the largest of the three estimators of Section 3.2 evaluated with the candidate treated as its own probe and removed from the comparison catalogue. Ties break by soft flux. No threshold is applied to either factor: the whole pool is ranked and the first twenty are printed. The adoption is not load-bearing for the ranking: re-scoring the pool under all six rows of the membership table changes no position in the top twenty (Spearman ρ = 1.00 in every row), because the score ordering is a cluster-centric-radius ordering under any of them (paper/g/calc7/g_calc7_anchor_loo.json).
The reason for fixing the rule in advance shows up in what the list then looks like.
The chance factor barely moves the ranking. Over the whole pool the three estimators return between 2.5×10⁻⁴ and 3.2×10⁻³, so (1 − Pchance) never moves a candidate more than one place. The ordering is the membership probability, which under a spatial model is a monotonic function of cluster-centric radius. The rank column is therefore close to a radius ordering, and a reader should treat it as one. That is a property of the data rather than of the rule: with a catalogue this shallow and error circles this small, positional confusion is not what limits follow-up in this cluster.
Four rows are already identified. The pool is defined by the absence of a published optical identification, which is the catalogue's own field, and the eleven X-ray counterparts of radio MSPs carry none. Four of them survive the colour and flux cuts and rank in the top twenty (11f, 21d, 23g and 32d, flagged c). Three of those four are also the anchors that define the box, so their high rank is circular twice over and is not evidence that the score works. A follow-up programme would drop all four; the pre-registered pool retains them, and Table 8 flags rather than removes them. With them removed the first five entries are 12c, 11e, 13g, 22l and 24j.
No row is an identification. Section 5.7's upper-bound caveat applies unchanged: the region carries no AGN screen, and at the adopted limit the background expectation over this aperture is 146.9 sources. Most of this list is expected to be background, and the ordering is of follow-up effort rather than of likelihood.
| Rank | Source | r (″) | colour | Fsoft | Pmember | 103Pchance | R | flags |
|---|---|---|---|---|---|---|---|---|
| 1 | 12c | 36 | +0.22 | 4.0 | 0.612 | 1.0 | 0.611 | n |
| 2 | 11e | 50 | +0.00 | 3.6 | 0.601 | 0.7 | 0.601 | n |
| 3 | 13g | 70 | +0.12 | 4.8 | 0.580 | 0.9 | 0.579 | n |
| 4 | 22l | 79 | +0.14 | 6.2 | 0.569 | 1.0 | 0.568 | n |
| 5 | 11f | 95 | +0.17 | 4.1 | 0.547 | 0.7 | 0.547 | acn |
| 6 | 24j | 105 | +0.50 | 7.4 | 0.532 | 1.0 | 0.531 | n |
| 7 | 21d | 113 | −0.20 | 16.0 | 0.520 | 1.0 | 0.519 | ac |
| 8 | 21e | 116 | +0.63 | 13.9 | 0.515 | 1.0 | 0.515 | e |
| 9 | 23g | 118 | +0.68 | 5.5 | 0.513 | 1.0 | 0.512 | acn |
| 10 | 24d | 129 | +0.37 | 6.4 | 0.496 | 0.9 | 0.495 | – |
| 11 | 23e | 132 | +0.29 | 3.3 | 0.491 | 1.2 | 0.490 | ln |
| 12 | 21f | 132 | +0.64 | 6.9 | 0.491 | 1.6 | 0.490 | n |
| 13 | 24b | 136 | +0.38 | 6.0 | 0.483 | 1.0 | 0.483 | – |
| 14 | 22d | 140 | +0.34 | 7.3 | 0.478 | 0.9 | 0.478 | v |
| 15 | 34e | 150 | +0.09 | 6.0 | 0.461 | 0.9 | 0.461 | n |
| 16 | 34h | 167 | +0.06 | 4.5 | 0.434 | 0.8 | 0.434 | n |
| 17 | 31c | 180 | +0.40 | 6.9 | 0.414 | 0.7 | 0.414 | v |
| 18 | 31g | 181 | +0.15 | 5.0 | 0.412 | 0.7 | 0.412 | n |
| 19 | 32d | 195 | +0.44 | 5.4 | 0.391 | 2.8 | 0.390 | c |
| 20 | 31e | 195 | +0.15 | 3.3 | 0.391 | 3.1 | 0.390 | n |
8. Discussion
8.1 What would identify the residual
The residual is an input to identification work, and the useful output of this paper is a specific list of what that work requires. Each item below is a concrete, currently blocked step, ordered by cost.
The six missing pulsar positions. F, J, M, O, P and R carry no position in Colom i Bernadich et al. (2026). Recovering them from Chen et al. (2023) would extend the probe set by six probes and is the cheapest available improvement to every number in Section 5.
The counterpart-chain check. The MSP H discrepancy of Section 5.3 is resolvable by comparing the Zhao & Heinke (2023) source list against the Henleywillis et al. (2018) catalogue position by position. It requires no new observation.
Exposure-map membership. The degeneracy of Section 3.4 is instrumental and is fixed by the Chandra exposure map, which turns a spatial fit that cannot separate the cluster profile from the sensitivity profile into one that can. Membership would then be fitted rather than normalised externally, and the six-row sensitivity table of Table 5 would collapse to one row with an error bar.
Variability with epoch-resolved data. No variability analysis appears in this paper. Both the 2000 and 2012 Chandra epochs exist and the catalogue tabulates a flux ratio between them, but a single ratio does not support a statistically valid variability test at these count rates, and epoch-resolved event data are not staged here. This is the clearest gap between what this paper does and what a full identification programme needs, since variability is what separates quiescent binaries from background AGN when colour does not.
Deeper radio positions. Sub-arcsecond positions for the tier-2 pulsars would move five probes out of a tier whose uncertainty rule is a convention of ours rather than a measurement.
8.2 The census as an anomaly screen
A complete accounting of a cluster's X-ray sources doubles as a screen for sources fitting no known class, a standard byproduct of catalogue work worth one sentence of acknowledgement in a series that elsewhere considers non-astrophysical hypotheses (Swanson 2026). This census does not perform that screen. The residual computed here is background-dominated, consistent with zero, and defined by the absence of an optical identification rather than by any positive property; treating it as a population of anomalies would require the identification work Section 8.1 lists as outstanding, and until that work is done the residual carries no information about the nature of its members.
9. Conclusion
We have cross-matched the 233-source Chandra catalogue of Henleywillis et al. (2018) against the 19-pulsar timing set of Colom i Bernadich et al. (2026), validated the pipeline on 47 Tucanae first, and reported what is left.
The control recovers 18 of 21 known counterparts at the 95 per cent match radius and misses the three rows the control catalogue itself flags. The ω Cen Chandra frame carries a measured +0.41″ declination offset against the radio frame; registering it takes tier-1 matches from three of eight to five of eight, and the five registered associations sit between 0.01″ and 0.35″ with chance-coincidence probabilities below 2.3×10⁻³ under three independent estimators. The published association of MSP H with source 14c does not survive registration, sitting at 1.81″ in the wrong declination sense, which we record as a data-quality finding requiring a position-by-position check of the counterpart chain.
The residual census inside a 480″ aperture, matched at the same flux limit, is −1.9 unidentified sources (−70.5, +52.6) against a background expectation of 146.9 (92.4–215.5), which is to say it is consistent with the background alone. 39 (primary box) or 53 (secondary ellipse) unidentified sources fall in a colour-flux region defined by this cluster's own confirmed counterparts, two constructions built differently from the catalogue's own "more than 30" and not interchangeable with it or with each other. The two published population predictions differ by a factor of 54, and the larger over-predicts the residual by more than an order of magnitude, which bounds the extrapolation, the detection fraction, or the background subtraction without deciding among them. The practical output is Table 8, a ranked follow-up list under a rule fixed before the ranking was computed, together with the epoch-comparison depth each entry would require.
Data availability
The analysis pipeline (crossmatch.py, classify.py, residual.py, run_g.py), its fixed seed, its two results files and the mechanical analysis report accompany this paper under paper/g/analysis/. The vendored source catalogues, their checksums and their provenance record are under paper/g/data/. Both source catalogues are public at VizieR (J/MNRAS/479/2834 and J/MNRAS/472/3706). The v1.2 figures, the ranked candidate list and the epoch-comparison table are produced by paper/figs/fG_expand_v1.py, which reproduces and asserts the analysis of record before computing anything new; the candidate list is machine-readable at figs/fG_target_list.json.
Appendix A. Caveat checklist
The following are stated as limitations of this analysis and are not corrected for.
- Eddington bias. Fluxes near the detection limit are biased high, so a background count computed above a limit derived from those same fluxes is a lower bound on contamination. No deboosting is possible without the detection-significance distribution, which the vendored table does not carry.
- Completeness varies with off-axis angle across the ACIS-I field. A single flux limit is applied over the whole area, which overestimates the effective depth at large radius and therefore overestimates the background count there while underestimating the true source count.
- No variability analysis is performed. Epoch-resolved data are not staged and the single tabulated 2012/2000 flux ratio does not support a Poisson-honest test. Explicitly out of scope, and the largest departure from what a full identification programme requires. Appendix B states what the missing work would cost without doing it.
- The residual is an input to future identification work. It is not a detection and it is not evidence for any hypothesis.
- Chance-coincidence rates are reported per probe by three independent estimators and are never collapsed into one number.
- Membership is reported as a probability under stated external normalisations, never as a binary label, and every published membership statement is carried alongside rather than overwritten.
- The tier-2 positional uncertainty rule is a convention of this analysis (one unit in the last quoted digit), not a value stated by the source paper.
- The escape-velocity population relation was fitted on FAST-visible clusters and ω Cen is not FAST-visible, so its prediction here is an extrapolation.
- The background-relation parameter uncertainties are published asymmetrically and are used here only as symmetric bracket widths; no asymmetric error is quoted.
- The internal membership fit is degenerate and is reported as a diagnostic only; membership uses external normalisations throughout.
- The control is an optimistic bound. The control catalogue was itself astrometrically registered against its MSP truth set, so control recovery bounds match performance from above rather than testing astrometry independently.
- The candidate ranking is a follow-up ordering, not a set of identifications. Its rule was fixed before it was computed, its chance-coincidence factor is numerically inert, and four of its top twenty rows are already-identified MSP counterparts that the pre-registered pool definition retains.
- The epoch-comparison table of Appendix B assumes the shallower epoch differs from the deeper one only in exposure. It does not, so the tabulated sensitivity is a floor.
- Six pulsars are absent from the cross-match for want of a published position, so every match count is conditional on a 13-probe subset of the 19-pulsar timing set.
Appendix B. What an epoch comparison would cost
Variability is absent from this paper and Appendix A lists that absence as its largest departure from a full identification programme. This appendix states what that work would cost. It analyses no epoch-resolved data and classifies no source as variable; it converts the catalogue's own counts into the sensitivity a two-epoch comparison would have.
The catalogue's counts come from the 2012 ACIS-I exposure alone, 173.7 and 48.5 ks (Henleywillis et al. 2018). The other deep Chandra epoch of this field is the ~70 ks exposure of Haggard et al. (2009), so a second epoch collects r = 0.315 of the counts at constant flux. Propagating Poisson errors on the two rates, the smallest flux ratio a three-sigma comparison could detect is Rmin = exp[3(1/n2012 + 1/n2000)1/2]. Table 9 counts how many sources clear each threshold. Rows are given twice: once restricted to sources where the shallower epoch expects at least ten counts, which is where the Gaussian propagation holds, and once without that restriction. The restriction bites at 31.7 counts in the deep epoch, where Rmin is already 2.95, so requiring validity and requiring a factor of three are nearly the same cut and neither is presented as the answer alone.
| Flux ratio | aperture (200), Gaussian regime | pool (39), Gaussian regime | aperture (200), no validity cut | pool (39), no validity cut |
|---|---|---|---|---|
| 1.5 | 18 | 0 | 18 | 0 |
| 2.0 | 53 | 0 | 53 | 0 |
| 3.0 | 98 | 10 | 98 | 10 |
| 5.0 | 98 | 10 | 165 | 35 |
| 10.0 | 98 | 10 | 194 | 39 |
The candidate pool is worse placed than the aperture at large. Ninety-eight of the 200 aperture sources sit in the Gaussian regime and 53 would show a factor-of-two change, but none of those 53 is in the candidate pool: the MSP-like region selects faint sources, and the five best-placed pool members need factors of 4.0 to 6.0. Reaching a factor of two on the top of Table 8 needs new exposure, not a re-reduction of the archive. The comparison itself carries costs this arithmetic does not price. The 2000 exposure reaches a limiting flux of ~4.3×10⁻¹⁶ erg cm−2 s−1 against ~3×10⁻¹⁶ for the 2012 data, and the two reductions differ in aperture, off-axis angle and extraction, so Rmin is a floor rather than a forecast.
An all-sky survey does not substitute. Four of the 200 aperture sources reach the eRASS1 50 per cent completeness limit of 5×10⁻¹⁴ erg cm−2 s−1 (Merloni et al. 2024), and 106 of the 200 have a catalogue neighbour inside the 26″ half-energy width that eROSITA averages over its field of view (Predehl et al. 2021). Its depth and its beam each rule it out for this field independently.
Appendix C. Per-source table for the twelve finding-chart candidates
The finding chart (Figure 3) numbers the twelve highest-ranked non-counterpart candidates of the 39-source colour-flux pool in pre-registered rank order (Section 7; figs/fG_target_list.json ranks 1–4, 6, 8, 10–15 after removing the four confirmed MSP counterparts). Table 10 gives the machine-readable row for each, from the vendored census (data/xray_census.json, byte-parse of Henleywillis et al. (2018) table1.dat) and the ranked pool (figs/fG_target_list.json), with the epoch depth from figs/fG_expand_variability.json. Off-axis angle is proxied by cluster-centric radius r (the Chandra aimpoint is the cluster centre; ε95 grows with off-axis angle and is listed) and by the catalogue ε95. Net counts are the exposure- and vignetting-corrected 0.5–4.5 keV counts; flux is the unabsorbed 0.5–2.0 keV (soft) flux in 10−19 W m−2 (10−16 erg cm−2 s−1) under the Γ = 1.4 power-law assumed by the source catalogue. Where the 2012/2000 flux ratio is not tabulated the source is new in the 2012 data set and no ratio is computable at this count rate; the ratio floor for a 3σ change is in Table 9. Tier is the selection tier: all twelve are "unidentified, inside the 480″ aperture, colour and flux both tabulated, inside the n = 4 primary box"; flags are from the ranked pool (outside-ellipse, low-counts, variable-candidate).
| Chart | ID | RA (J2000) | Dec (J2000) | r (″) | ε95 (″) | C0.5–4.5 (corr) | Fsoft (10−19) | R (F12/F00) | Flags |
|---|---|---|---|---|---|---|---|---|---|
| 1 | 12c | 13h26m47.945s | −47:28:10.74 | 35.7 | 0.41 | 15.5 | 4.0 | — | n |
| 2 | 11e | 13h26m43.279s | −47:28:16.18 | 49.6 | 0.43 | 14.6 | 3.6 | — | n |
| 3 | 13g | 13h26m54.065s | −47:28:59.06 | 69.8 | 0.41 | 16.9 | 4.8 | — | n |
| 4 | 22l | 13h26m54.828s | −47:28:32.66 | 79.1 | 0.40 | 19.6 | 6.2 | — | n |
| 5 | 24j | 13h26m42.326s | −47:30:19.33 | 105.4 | 0.45 | 20.9 | 7.4 | — | n |
| 6 | 21e | 13h26m45.206s | −47:26:52.25 | 116.3 | 0.39 | 42.3 | 13.9 | 0.96 | e |
| 7 | 24d | 13h26m37.399s | −47:30:06.97 | 128.7 | 0.49 | 21.2 | 6.4 | 0.98 | — |
| 8 | 23e | 13h26m58.174s | −47:29:57.10 | 131.8 | 0.55 | 9.8 | 3.3 | — | n, l |
| 9 | 21f | 13h26m37.860s | −47:27:15.51 | 131.8 | 0.48 | 20.6 | 6.9 | — | n |
| 10 | 24b | 13h26m39.312s | −47:30:37.06 | 136.4 | 0.50 | 20.0 | 6.0 | 1.02 | — |
| 11 | 22d | 13h26m58.723s | −47:27:28.73 | 139.5 | 0.44 | 21.9 | 7.3 | 0.47 | v |
| 12 | 34e | 13h26m43.202s | −47:31:10.62 | 150.4 | 0.51 | 21.0 | 6.0 | — | n |
Chart order is pre-registered rank order after removing confirmed MSP counterparts (see Figure 3 caption; ranks 1–4, 6, 8, 10–15 in figs/fG_target_list.json). R is the catalogue 2012/2000 flux ratio where tabulated; "—" denotes a new 2012 source with no computable ratio (compare Table 9). Flags: n = new in 2012, e = inside box but outside 2σ ellipse, l = fewer than 10 corrected counts, v = catalogued flux ratio beyond a factor of two (>2). All twelve are unidentified and inside the primary box.
References
- Anderson, J. and van der Marel, R. P. (2010). New limits on an intermediate-mass black hole in Omega Centauri. I. Hubble Space Telescope photometry and proper motions. The Astrophysical Journal, 710:1032–1062. doi:10.1088/0004-637X/710/2/1032
- Bhattacharya, S., Heinke, C. O., Chugunov, A. I., Freire, P. C. C., Ridolfi, A., and Bogdanov, S. (2017). Chandra studies of the globular cluster 47 Tucanae: A deeper x-ray source catalogue, five new x-ray counterparts to millisecond radio pulsars, and new constraints to r-mode instability window. Monthly Notices of the Royal Astronomical Society, 472:3706–3721. arXiv:1709.01807 · doi:10.1093/mnras/stx2241
- Chen, W., Freire, P. C. C., Ridolfi, A., Barr, E. D., Stappers, B., Kramer, M., et al. (2023). MeerKAT discovery of 13 new pulsars in Omega Centauri. Monthly Notices of the Royal Astronomical Society, 520:3847–3856. arXiv:2301.03864 · doi:10.1093/mnras/stad029
- Colom i Bernadich, M., Dai, S., Abbate, F., Kerr, M., Bachetti, M., Buchner, S., Johnston, S., Burgay, M., Possenti, A., Ridolfi, A., Freire, P. C. C., Kramer, M., Stappers, B., et al. (2026). A joint MeerKAT and Parkes view of Omega Centauri: New TRAPUM searches and pulsar timing. arXiv e-prints, page arXiv:2603.21845. Under review. arXiv:2603.21845
- Feigelson, E. D. and Nelson, P. I. (1985). Statistical methods for astronomical data with upper limits. I - Univariate distributions. The Astrophysical Journal, 293:192–206. doi:10.1086/163225
- Haggard, D., Cool, A. M., and Davies, M. B. (2009). A Chandra study of the Galactic globular cluster Omega Centauri. The Astrophysical Journal, 697:224–236. arXiv:0902.2397 · doi:10.1088/0004-637X/697/1/224
- Henleywillis, S., Cool, A. M., Haggard, D., Heinke, C., Callanan, P., and Zhao, Y. (2018). A deep x-ray survey of the globular cluster Omega Centauri. Monthly Notices of the Royal Astronomical Society, 479:2834–2852. arXiv:1803.04822 · doi:10.1093/mnras/sty675
- Merloni, A., Lamer, G., Liu, T., et al. (2024). The SRG/eROSITA all-sky survey: First x-ray catalogues and data release of the western Galactic hemisphere. Astronomy & Astrophysics, 682:A34. arXiv:2401.17274 · doi:10.1051/0004-6361/202347165
- Moretti, A., Campana, S., Lazzati, D., and Tagliaferri, G. (2003). The resolved fraction of the cosmic x-ray background. The Astrophysical Journal, 588:696–703. doi:10.1086/374335
- Predehl, P., Andritschke, R., Arefiev, V., et al. (2021). The eROSITA x-ray telescope on SRG. Astronomy & Astrophysics, 647:A1. arXiv:2010.03477 · doi:10.1051/0004-6361/202039313
- Swanson, T. (2026). Engineered intermediate-mass black hole systems: Infrastructure constraints, observable residue, and a multi-messenger adjudication framework. Preprint; omegacentauri.me.
- Yin, D., Zhang, L., Qian, L., Pan, Z., Li, D., et al. (2024). An empirical-Bayesian estimate of the pulsar populations of globular clusters. The Astrophysical Journal Letters, 969:L7. arXiv:2405.18228
- Zhao, J. and Heinke, C. O. (2023). A Chandra x-ray study of millisecond pulsars in the globular cluster Omega Centauri: A correlation between spider pulsar companion mass and x-ray luminosity. Monthly Notices of the Royal Astronomical Society. arXiv:2309.13189